2026-10-04 · Africa Flying
We withdrew an accuracy number because we could not reproduce it
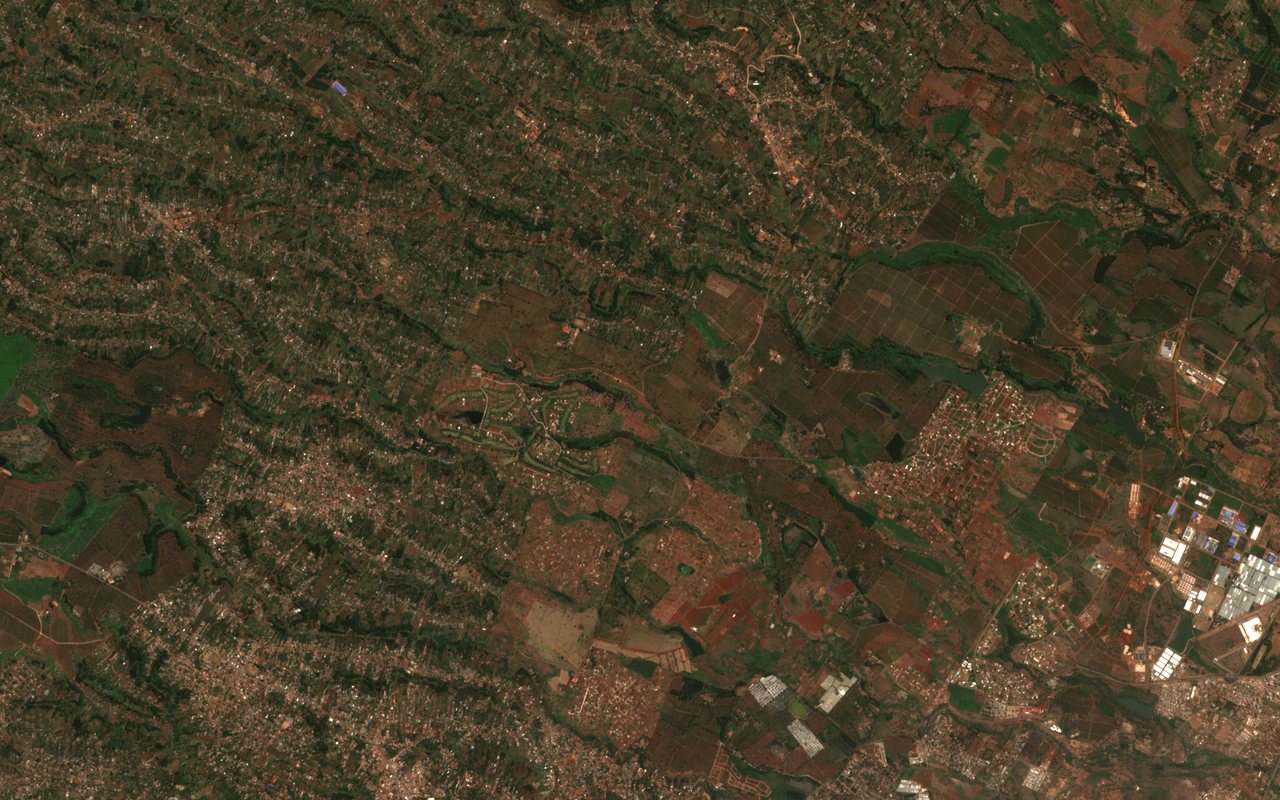
The ground in the picture is the kind of land a crop-health model has to say something about: farm plots, housing and roads side by side, seen by the Sentinel-2 satellite north of Nairobi. The model we are building tries to forecast a vegetation index, called NDVI, which is a measure of how green and healthy plants look from space.
In August we told people the model had a very low error. On 27 September we withdrew that statement. We could not reproduce the number, and when we read the code that produced it we found four faults. It built its training windows across different towns, so the model sometimes saw one place followed by another as if they were a single story. It filled missing rainfall and soil moisture with zeros and treated them as real. It adjusted its scaling using all the data before holding any back for testing. And it split the data by row order rather than by place or by time. Any one of these can flatter a result. Together they made the August figure meaningless, and the honest thing was to say so.
The rework fixed the cause rather than the symptom. Features are now built in one place, per location. Rainfall comes from real CHIRPS records and is used only when at least 80 percent of it is present. Soil moisture and land temperature are left out, with the reason recorded, because we do not yet ingest a real source for them. (The corridor weather table does use NASA POWER data, but the neural pipeline does not read it today.) Training now splits by place or time, fits its scaling on the training rows only, reports its error next to a naive baseline, and writes a versioned file with its settings. The inference server refuses weights that arrive without valid settings.
The result is uncomfortable but correct. The model file that was on the machine from 24 September covered only 31 towns with a handful of rows each, and under the new rules it produces zero training windows. So today no model is trained on honest data, the server reports itself as degraded, and nothing is served as a forecast. We would rather show you that status than a number we cannot defend. (Update, 19 October 2026: on 16 October a research prototype was trained on an offline extract under these rules. It is an offline test and is not deployed.) The status page shows it, and the satellites page lists the real data sources the work depends on.
This is a software and simulation result. Africa Flying is in a pre-operations phase, and no forecast here is used for any real-world operation.
Read next
- From 224 to 621 passing tests: how a clean test run was recovered on one laptop.
- Two of seven: the satellite handler audit: the data sources underneath this model.
- 7,444 places: the list of towns the data is gathered for.
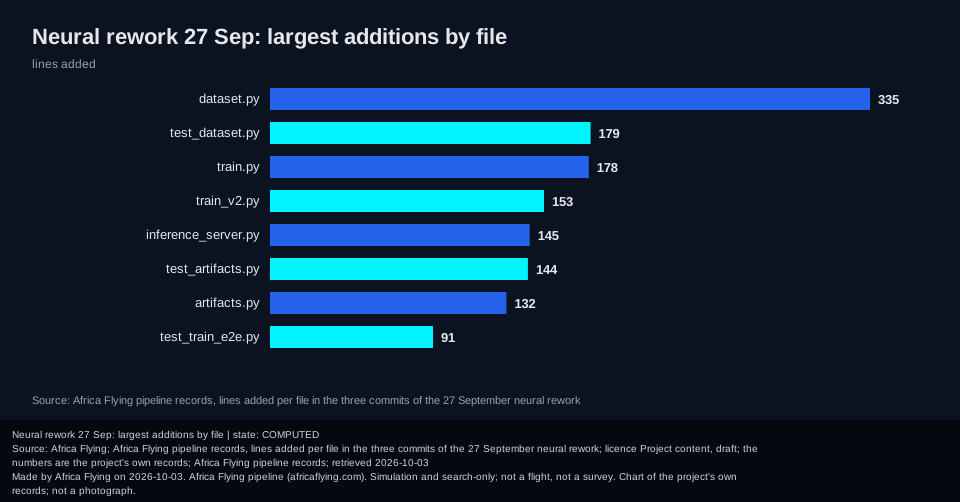
The detail chart
For the curious: where the rework's new code went. It is secondary to the story above.
Sources and credits
- Copernicus Sentinel-2: the European Earth-observation satellites that took the picture above (data open, with attribution).
- CHIRPS rainfall: a long-running open rainfall record for the tropics, from the Climate Hazards Center at UC Santa Barbara.
- NASA POWER: open daily weather and solar data from NASA, used for the corridor weather table.