2026-10-04 · Africa Flying
We pushed the whole local stack until it bent
On 26 September 2026 we ran a nine-phase load test against the full local stack, the whole set of services that make up the pipeline, which came to 40 containers and 45 web endpoints. We changed no code first; the point was to see what the system really did. It produced 11 findings.
The good news is stability. In a five-minute run, 50 clients at once sent 13,284 requests to a cached endpoint of the Django backend with no errors at all, and the speed did not degrade over time.
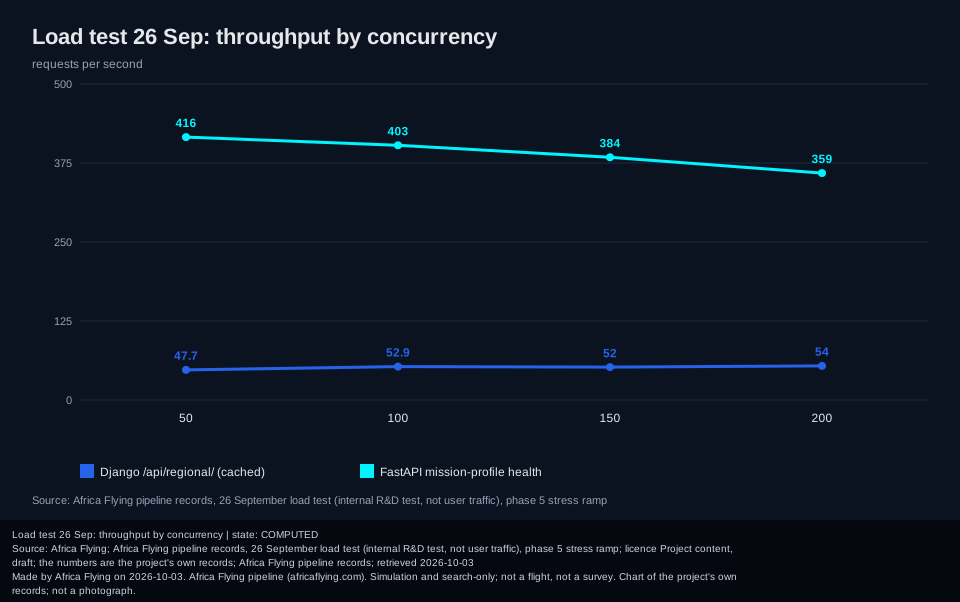
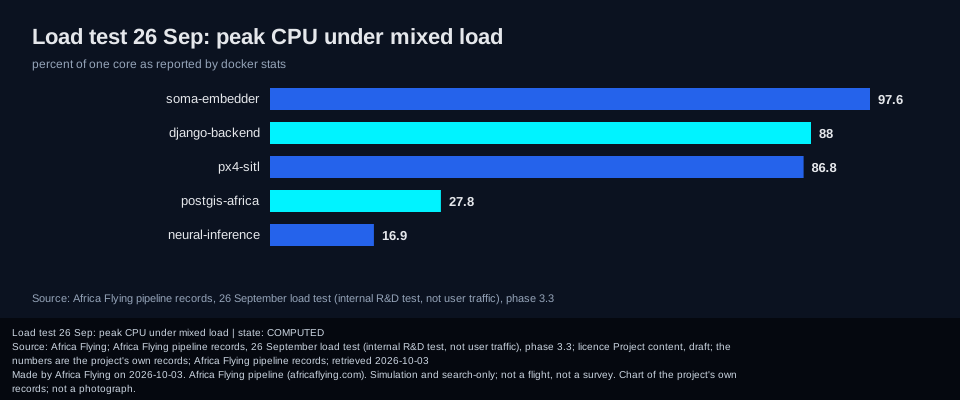
The honest limit is speed. That same endpoint flattened at about 55 requests per second, whether 50 or 200 clients pushed on it, because the backend was running as a single process: more clients just meant a longer queue. A lighter service, the mission-profile health check, handled several hundred a second. On 27 September the worker counts were sized from the number of CPU cores, so that limit has already moved, though we have not yet measured by how much. A look at which services worked hardest showed the soma-embedder service and the Django backend running close to their ceiling, while the database and the neural inference service ran far lighter. The charts at the end have the exact figures.
The test also turned up real problems: two endpoints that broke under pressure (the next post is about them), a translation service that stopped answering above roughly ten clients, and a Redis Sentinel that kept a stale address after a restart. That is what a load test is for.
One more caveat belongs in the headline of any summary: these are measurements of a local stack on one laptop. They are not production capacity figures, and Africa Flying is a pre-operations simulation platform. The current state of the services is on the status page.
Read next
- Two slow endpoints, two fixes: what was done about the two worst findings.
- Two of seven: the satellite handler audit: the other audit of 24 September.
- From 224 to 621: the test-run story from the day before.
The detail charts
Throughput as the number of clients grows, and peak CPU by service. Secondary to the story above.
Sources and credits
- Redis Sentinel: the failover tool whose stale address the test found.